

Structural biology
OpenReadout reads the files of cryo-EM, electron tomography and X-ray and electron crystallography as they come off the detector:
| what | format id | files | page |
|---|---|---|---|
| Falcon electron-event movies | tiff |
.eer (and the .gain reference) |
TIFF § EER |
| K2/K3 movies saved as TIFF | tiff |
.tif (LZW), gain reference .dm4 or .mrc |
TIFF, DM |
| movies, stacks, tilt series, maps | mrc |
.mrc, .mrcs, .st, .ali, .rec, .map |
MRC |
| SerialEM metadata | mdoc |
.mdoc (on its own, or next to its stack) |
mdoc |
| X-ray and electron diffraction images | cbf |
.cbf, .cbf.gz (PILATUS, EIGER, full imgCIF) |
CBF |
smv |
.img (ADSC, Ceta, TimePix) |
SMV | |
nxmx |
*_master.h5, .nxs with their data files (EIGER, JUNGFRAU) |
NXmx |
Every diffraction reader puts the beam and detector geometry in one place, images[].extra.diffraction: wavelength (Å), detector distance (mm), beam centre (pixels), pixel size, rotation axis, start and width, exposure, the overload value and which pixel values mean “no measurement”. info turns it into the experiment: single-crystal X-ray diffraction or electron diffraction, with those settings as method parameters and the resolution in the detector’s corners.
A diffraction image
$ openreadout preview Therm_6_1_master.h5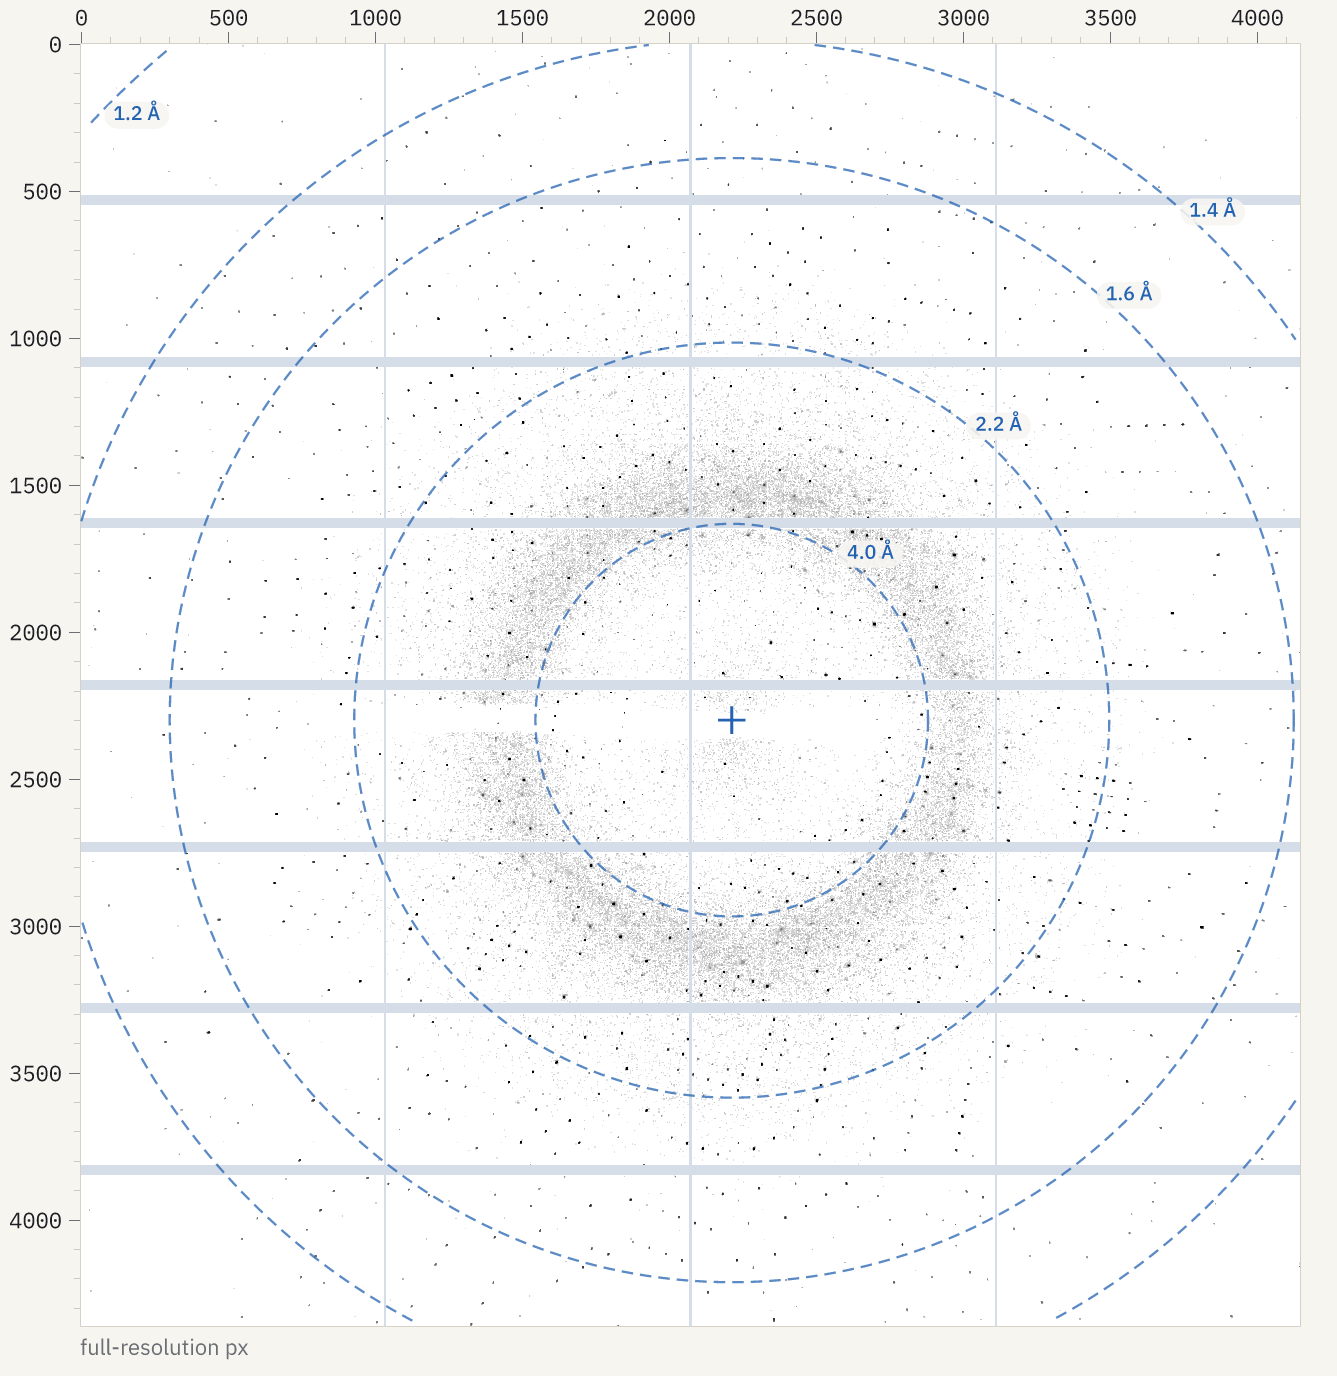
On a diffraction image the preview does what a crystallographer’s viewer does: it shrinks the image by taking the maximum of each block, so one-pixel Bragg spots survive, uses logarithmic contrast from the background to the brightest spots (log:90,99.95), draws dark spots on a light ground, shows module gaps and bad pixels in pale blue-grey and overloads in red, and draws resolution rings around the beam centre. The result lists each ring (marks: resolution_ring with its resolution in Å and radius in pixels) and the beam centre. --marks none leaves the rings out; --contrast and --lut change the rest.
A sweep of EIGER images is one image with a time point per frame: --select t=100 shows frame 100, and plot with show: frames draws a value per frame (the rotation angle, or mean, sum, max of the pixels).
A cryo-EM movie
$ openreadout preview glacios_00817_1-7.eer --sum t --fft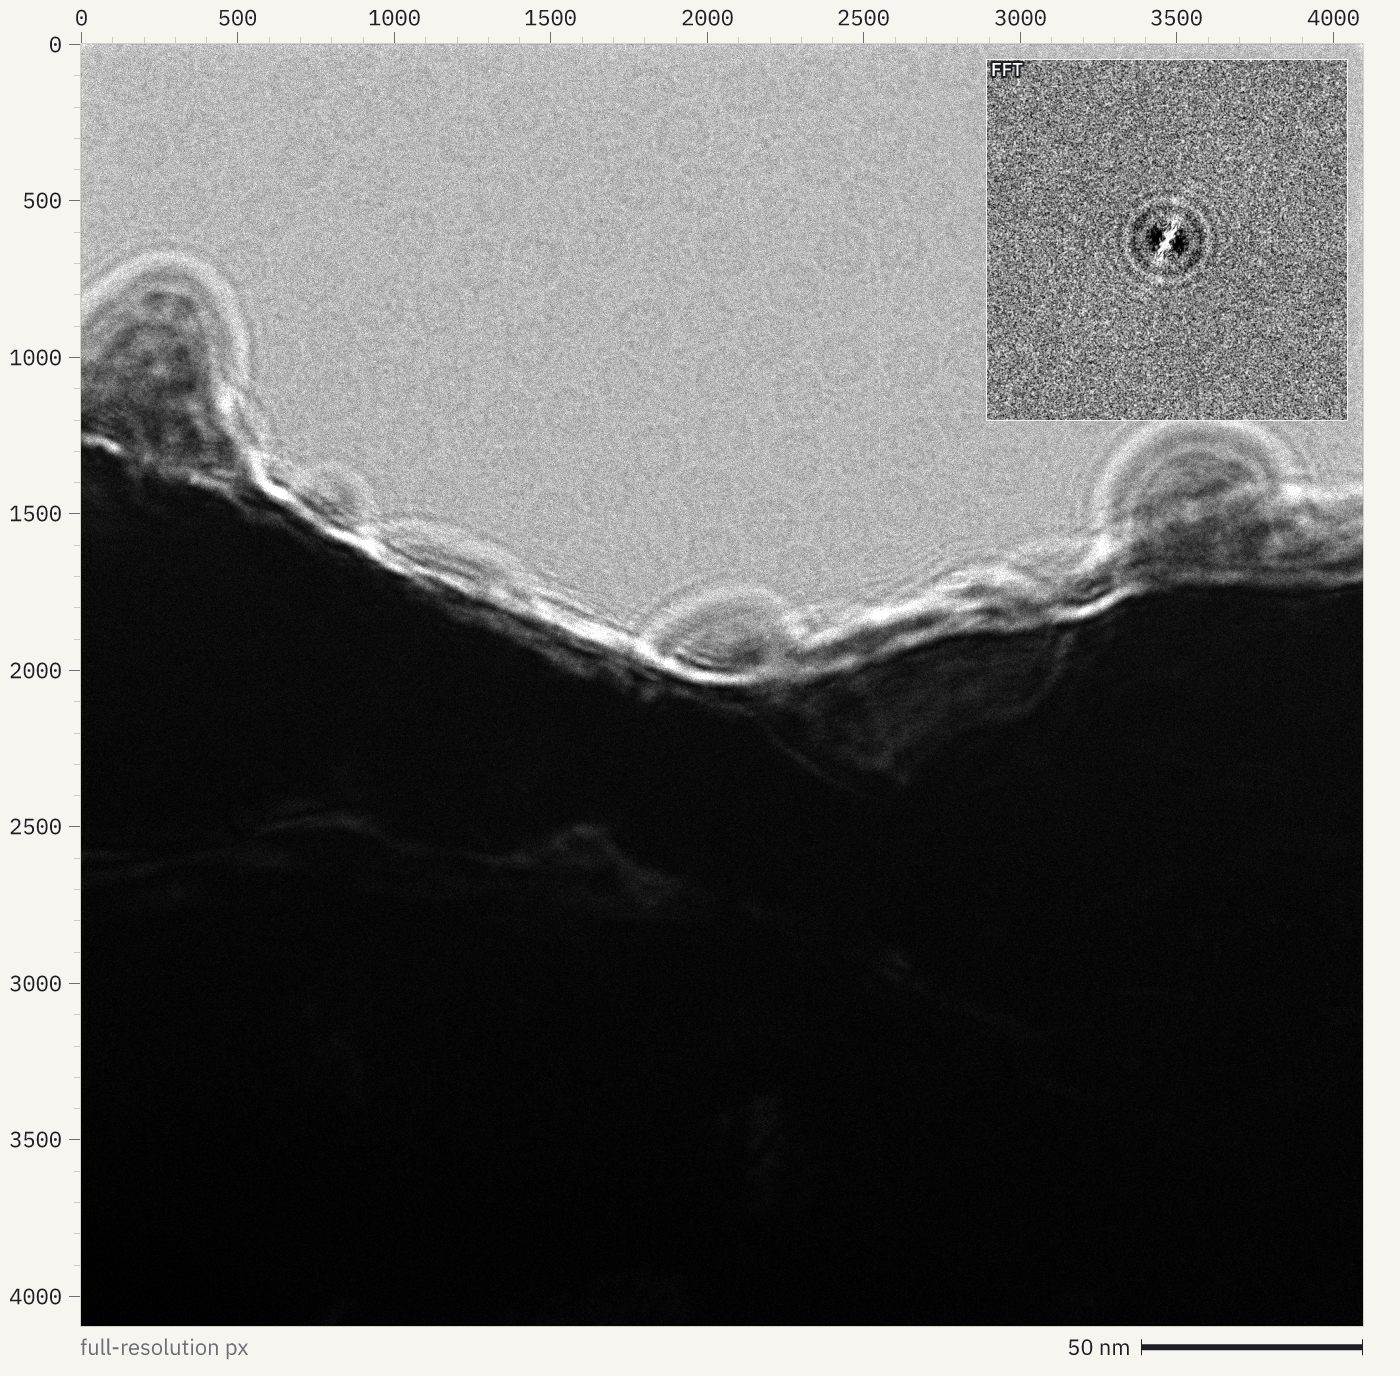
--sum t adds the frames up (all of them, or --select t=0-39); for EER movies the events are added straight into one count per pixel, so a 648-frame movie sums in seconds. --fft puts the power spectrum of the middle of the image in the corner: the Thon rings show the defocus and astigmatism. The gain reference is not applied.
$ openreadout export glacios_00817_1-7.eer --format mrc --group-frames 40wrote glacios_00817_1-7.mrcs (MRC mode 6, 17 image stack section(s) from 648 plane(s), 40 frames per section, 570426368 bytes, verified=true)--group-frames writes the movie as dose fractions; without it every frame is a section. plot with show: frames draws the dose each EER frame records.
A tilt series
SerialEM writes an .mdoc next to each stack. Opened on its own it is a table, a row per tilt; next to its MRC stack, its values become the stack’s frame records. The dose is accumulated in acquisition order, which shows the tilt scheme:
{"data": {"file": "G3_TS_001.mrc.mdoc", "x": "tilt_angle_deg", "y": "cumulative_dose_e_per_a2", "mark": "points"}}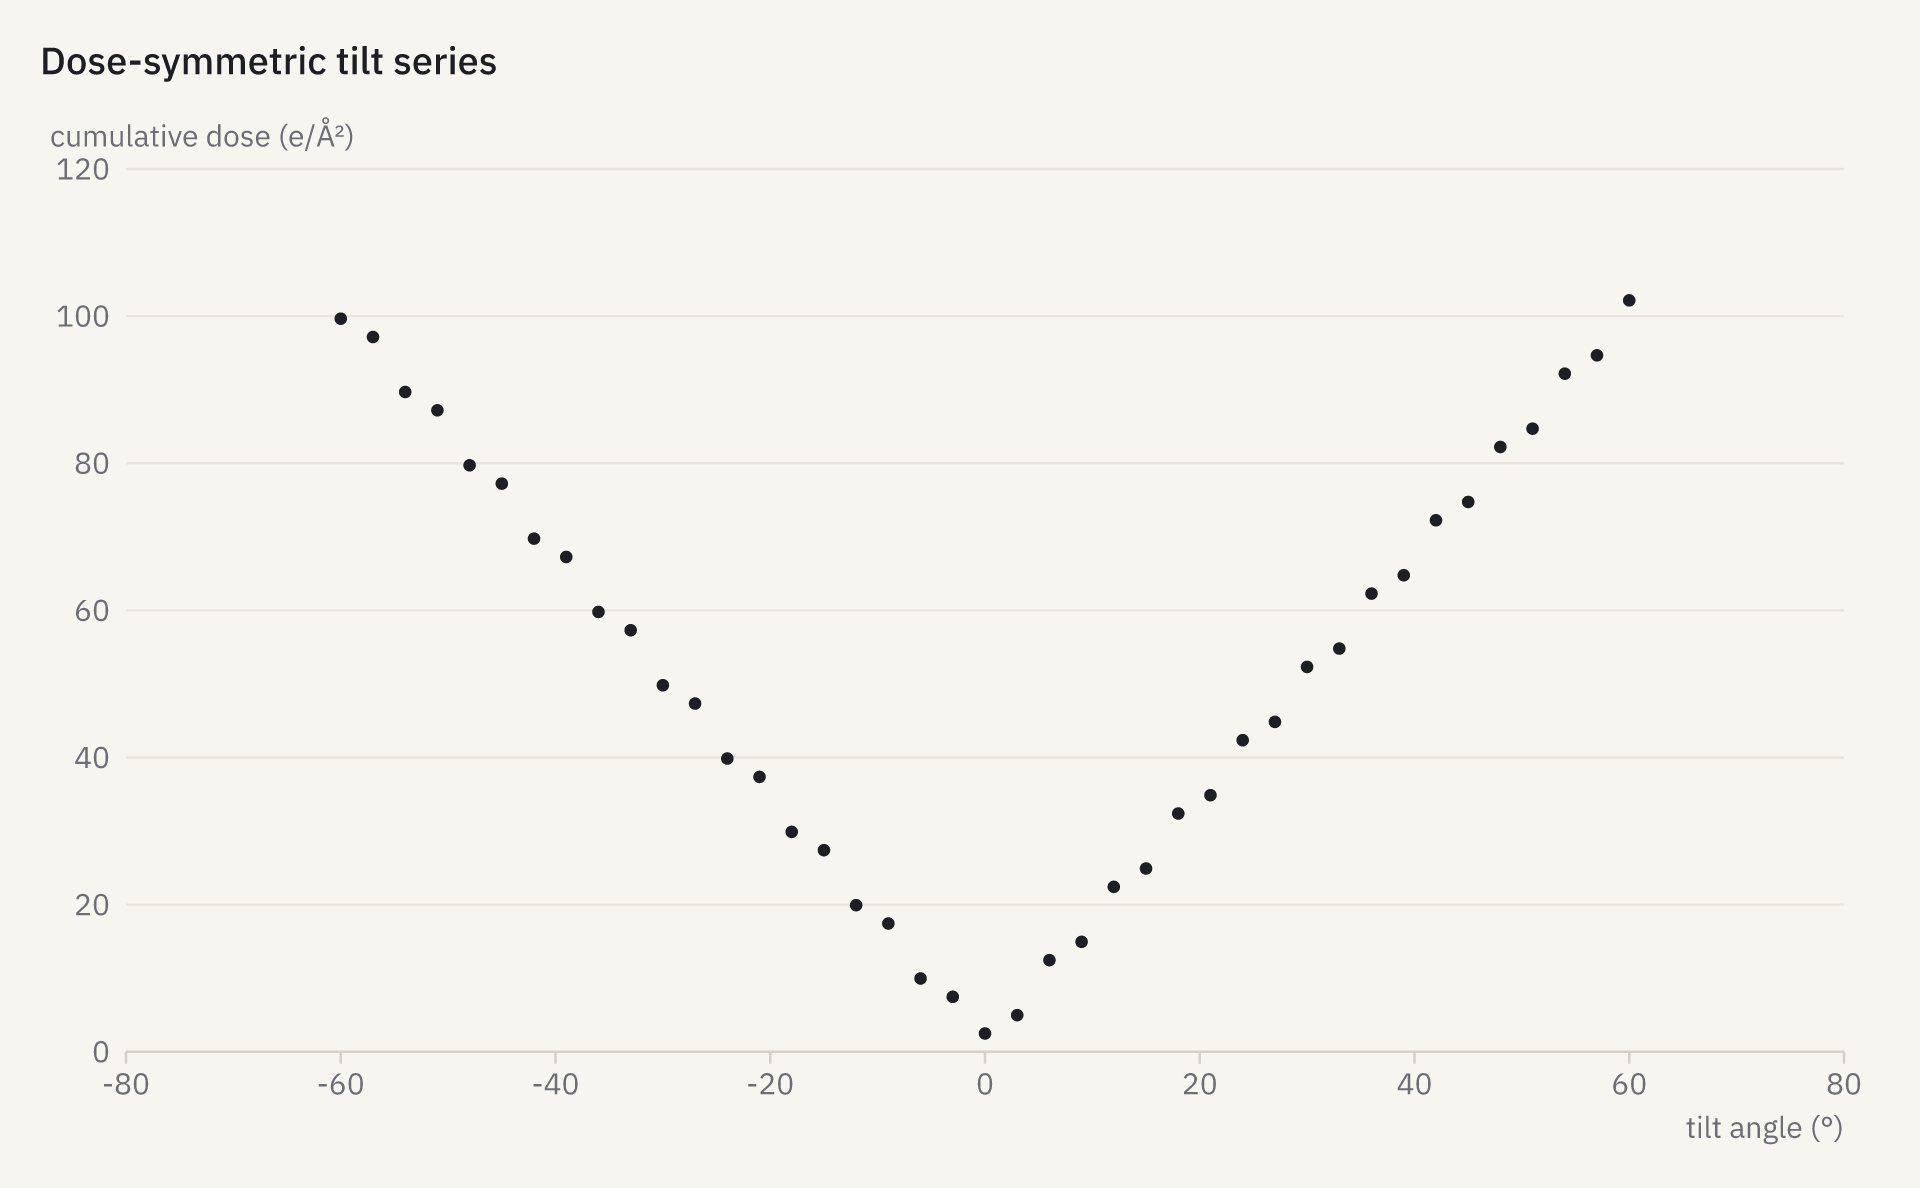
Not read
- Bruker
.sfrm, Rigaku and Oxford Diffraction.rodhypiximages, MAR345 and Rayonix MarCCD images: less common today, and no openly licensed test files were found for most of them. - Gain references are read, not applied: whether a gain image must be rotated or flipped to match a movie depends on the camera setup, and getting it wrong changes the data without warning.
- Virtual datasets in NeXus files: the data files they point at are read instead.