

Thermo Fisher NanoDrop exports
NanoDrop spectrophotometers measure nucleic-acid and protein concentration and purity from a 1-2 µL drop. Their software exports the results as text. OpenReadout reads four of those exports as a table of samples with units, and returns the absorbance spectra when the export holds them. Derived from public export files of two depositors, with allotropy (MIT) and pandas (BSD-3) as reference readers. Provenance: docs/provenance/nanodrop.md. Crate: openreadout-benchtop.
| format id | files | reads | confidence |
|---|---|---|---|
nanodrop |
NanoDrop 8000 reports (.txt), NanoDrop Eight exports (.txt, .tsv), NanoDrop One reports (.csv) and UV-Vis spectrum exports (.tsv) |
one row per measurement: sample, time, concentration with its unit, A260, A280, A260/A280, A260/A230 and the application’s other columns; spectra as a trace | see cargo xtask assurance-audit |
Not read: native NanoDrop workbooks (.twbk, .sql: one public depositor only) and Excel saves of the exports. The reader returns the values the NanoDrop software wrote. It does not recompute concentrations.
Layouts
The reader recognises an export by its first lines, never by its extension. info names the layout in format_version and tables[0].extra.layout.
| layout | first line | holds |
|---|---|---|
nanodrop-8000 |
Plate ID<tab>Well<tab>Sample ID<tab>User ID<tab>Date<tab>Time<tab>... |
the 8000 (and 2000) software’s report: nucleic acid (Conc., Units, A260, A280, 260/280, 260/230, Conc. Factor (ng/ul), 340 raw, NA Type), Protein A280 (conc., units, A280 10mm, E 1%, Ext. Coeff x10e3, Mol. Wt. kDa) or a custom method (nm 1/Abs 1 … nm 4/Abs 4, Formula Name 1, Formula 1, Formula Value 1). A blank line may be followed by a second table, the standards of a standard curve |
nanodrop-eight |
Application:<tab>dsDNA, then Serial Number:, User Name: lines |
a table Sample Id (a unique id), Sample Name, Date & Time, Location, ng/µL, A260/A280, A260/A230, A260, A280, then one column per wavelength (220.0 … 350.0, every 0.5 nm) holding the spectrum. Variants: decimal commas, header lines padded with tabs, a comma-separated save (Application:,dsDNA, dates 08-Dec-2023 13:38:55), and an RNA layout Date, UID, Sample, Username, … without spectra |
nanodrop-one |
Date,Sample Name,Nucleic Acid(ng/uL),A260/A280,... |
the One’s report, comma- or tab-separated (the same header row): concentration, ratios, Nucleic Acid Factor, Baseline Correction (nm), Baseline Absorbance, corrected concentration and impurity columns |
nanodrop-spectra |
a sample line, a date line, then Wavelength (nm)<tab>10mm Absorbance |
the One’s UV-Vis spectrum export: one block per measurement, //WLCalib and //QSpecEnd lines, then wavelength and absorbance pairs (190-850 nm every 0.5 nm); blocks are separated by blank lines |
Text is UTF-8, UTF-16 with a byte-order mark, or Latin-1. Fields may be quoted. A number may use a decimal comma (0,4122) or exponent notation (1.449E+0). NaN, ERROR and empty cells are missing values.
Dates are written month first (5/26/2020 and 3:36 PM, 06/16/2022 04:38:28 PM(-07:00)). A date whose first number is above 12 is read day first. The UTC offset is kept when the export writes one. measured_at is ISO 8601 local time.
What the reader returns
-
Table 0
samples(extra.kindsamples): one row per measurement. Each column has our name, its header as the label and its unit. Text columns are category codes (extra.categories).name meaning unit samplethe sample name ( Sample IDin the 8000 report,Sample Name/Samplein the others)sample_uidthe Eight’s unique id of the measurement ( Sample Id,UID)plate,well,locationposition on the 8000’s plate or the Eight’s pedestal userthe user the export names measured_atdate and time, ISO 8601 concentrationthe NanoDrop’s concentration (nucleic acid or protein) ng/µL,mg/mL, as theUnitscolumn or the header statesa230,a260,a280absorbance (10 mm path) a260_a280,a260_a230purity ratios factorthe application’s concentration factor (ng/µL per absorbance unit) a340_rawthe 8000’s raw absorbance at 340 nm (the baseline) nucleic_acid_typethe 8000’s NA Type(DNA-50,RNA-40)cursor_wavelength,cursor_absorbancethe cursor position and its absorbance nme1_percent,extinction_coefficient_1e3,extinction_coefficient,molecular_weightprotein settings L/(mol·cm),kDa,g/molbaseline_wavelength,baseline_absorbancethe One’s baseline correction nmcorrected_concentration,corrected_cvthe One’s corrected concentration and its CV ng/µL,%wavelength_1…wavelength_4,absorbance_1…absorbance_4,formula_name_1,formula_1,formula_value_1a custom method’s wavelengths, absorbances and formula nmconcentration_notetext the instrument wrote instead of a concentration Other columns keep a name made from their header (lower case,
_between words).Concentrations are in one unit per column. When rows state different mass-per-volume units, the values are converted to the most common one, with an
infofinding. -
Trace 0
absorbance(Eight and spectrum exports): one sweep per sample row, channelabsorbance,extra.axisthe regular wavelength axis in nm (first,last,step). Values are as stored. -
In the spectrum export,
a230,a260,a280and the ratios are read off each spectrum at those wavelengths. They have no 340 nm baseline correction, unlike the NanoDrop nucleic-acid application’s ratios. -
Experiment: instrument vendor Thermo Fisher Scientific, model from the layout (NanoDrop 8000, Eight, One), serial (Eight), kind spectrophotometer; method name the application (
dsDNA,DNA-50,Protein A280,UV-Vis), technique ultraviolet-visible spectrophotometry; acquisition from the earliest to the latest sample time; operator; the sample name when there is one sample. -
check: ragged rows and unreadable lines. -
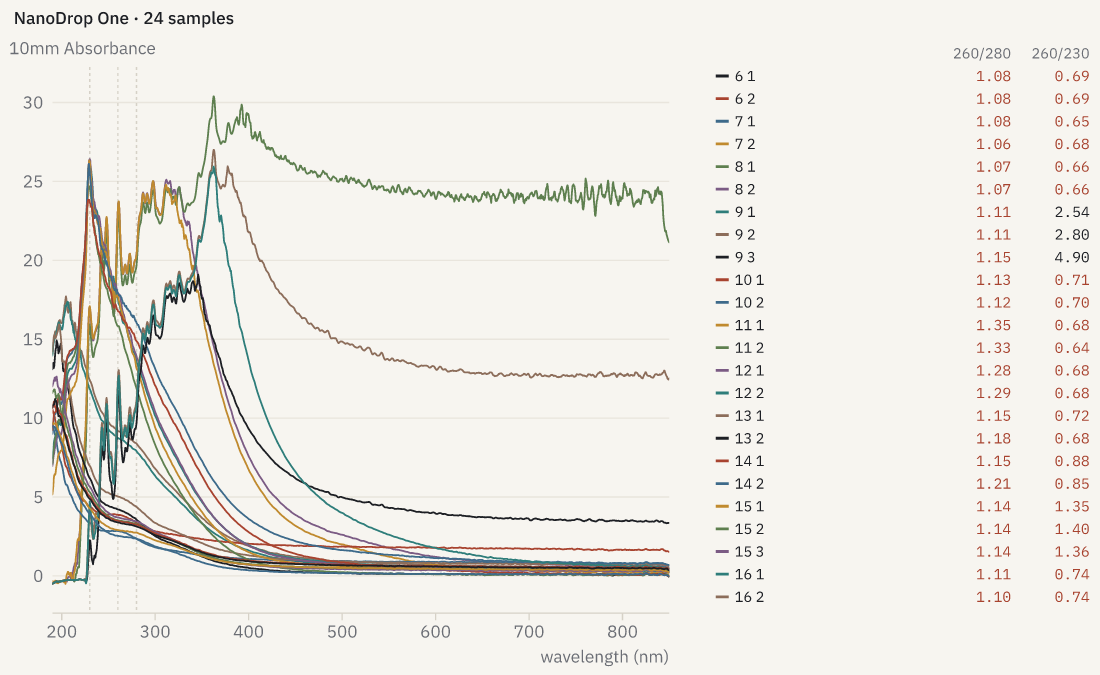
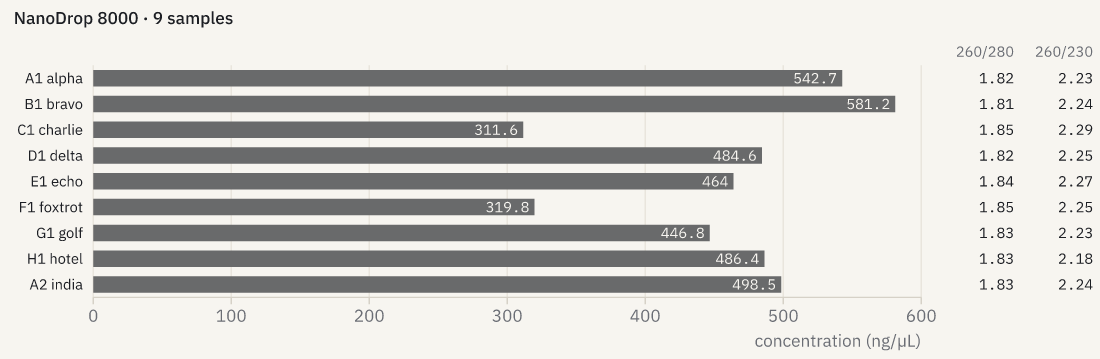
previewdraws the spectra overlaid with 230, 260 and 280 nm marked, beside a table of each sample’s concentration and ratios. Without spectra it draws each sample’s concentration as a bar with its ratios. A260/A280 below 1.7 and A260/A230 below 1.8 are drawn in the accent colour. -
batch tablegives every row of every file, so a folder of exports becomes one table.
Validation
cargo test -p openreadout-corpus-tests --features corpus (tests/corpus/benchtop_oracle/mod.rs, oracle/benchtop_oracle.py). allotropy (MIT, Benchling) converts each report to Allotrope Simple Model JSON with its own parser. Per sample in file order, the comparison checks the sample name, the concentration (unit-converted), the absorbances at 260 and 280 nm and the A260/A280 and A260/A230 ratios, and the instrument model and serial. pandas reads the spectra of the Eight exports and of the One’s spectrum export: each spectrum’s wavelength range, point count and absorbance at 32 points.
Vocabulary (public API of openreadout-benchtop, NanoDrop)
| identifier | meaning |
|---|---|
NanoDropReader |
reader of NanoDrop exports |
NANODROP_FORMAT_ID |
nanodrop |
SampleTableDataset |
the dataset the NanoDrop and Qubit readers return |
fuzz_nanodrop |
parse a NanoDrop export from bytes (fuzz targets only) |
Pictures
openreadout preview draws an export with spectra as the spectra overlaid, with 230, 260 and 280 nm marked, beside each sample’s concentration and ratios. Ratios below the usual range of clean nucleic acid are in red.
An export without spectra is drawn as one bar per sample with its ratios:
Examples
openreadout info dsDNA.tsv # instrument, application, samples, spectraopenreadout table dsDNA.tsv # one row per sample, with unitsopenreadout trace dsDNA.tsv --sweep 2 # the spectrum of the third sampleopenreadout batch table nanodrop/ -o all.csv # every export of a folder as one tableHow this reader was derived, file by file: provenance log.