

Agilent Bioanalyzer and TapeStation exports
The Agilent 2100 Bioanalyzer (chips) and TapeStation (ScreenTapes) check the size, quantity and
integrity of DNA and RNA. Their native files are not documented, so OpenReadout reads the exports
their software writes: the Bioanalyzer’s XML export from 2100 Expert, and the TapeStation’s XML
with the electropherogram CSV next to it. It returns each well’s electropherogram on a size axis
(bp or nt), the instrument’s peaks, regions, concentrations, RIN, RINe and DIN, and the run’s
instrument and assay. Derived from the files with bioanalyzeR (MIT) read as documentation.
Provenance: docs/provenance/agilent-electrophoresis.md. Crate: openreadout-ce.
| format id | files | reads | confidence |
|---|---|---|---|
agilent-bioanalyzer-xml |
.xml (or .xml.gz) from 2100 Expert, File → Export → XML |
per well: the processed signal sized in bp or nt, peaks (size, migration time, height, area, concentration, molarity, % of total), RIN, total concentration; the chip, assay, instrument and user | medium (evidence rubric, docs/assurance.md) |
agilent-tapestation |
<name>.xml with <name>_Electropherogram.csv (either may be .gz) from TapeStation Analysis |
per lane: the signal sized against the ladder, peaks, regions, concentration, RINe, 28S/18S ratios, DIN; the ScreenTape, instrument and software | medium |
Not read: native .xad chips, TapeStation run files (.D1000, .RNA and the like) and
Fragment Analyzer .raw files, which have no public description; the Bioanalyzer’s raw signal
and gel image.
Layout
Bioanalyzer XML (root Chipset): Chips/Chip/AssayHeader (assay class and title),
ChipInformation (date, software, user, lots), Instrument (serial number, type, firmware),
AssayBody/DAAssaySetpoints/DAMAssayInfoMolecular (size and concentration units, the ladder),
and Files/File/Samples/Sample per well: WellNumber, Name, Category (Ladder marks the
ladder), DAResultStructures (DARIntegrator peaks, DARStandardCurve the ladder’s lengths
against aligned migration time, DARRIN, DARConcentration) and DASignals (the
RedFluorescence signal: start, step and aligned start and step in s, and ProcessedSignal,
base64 of little-endian float32 values).
TapeStation XML (root File): FileInformation (assay, run end), ScreenTapes/ScreenTape
(tape id, run date, temperature, time, instrument serial, software), Assay/Units, and
Samples/Sample per lane (WellNumber, Comment the sample name, Observations with Ladder
for the ladder, RNA with RINe, DIN, Peaks, Regions). The CSV has one column per lane
(header A1: name) and one row per position along the lane, without an axis: row i of n
lies at run distance (n − i) / n.
What the reader returns
- One trace per well with a signal: channel 0
size(bp or nt) is the abscissa (extra.axisirregular), channel 1 the signal (FU), channel 2 the well’s own position (timein s for the Bioanalyzer,run_distancein % for the TapeStation;extra.role: position). Only the ladder’s range is sized (extra.sized_range).extrahaswell,sample,category,rinordin. Bioanalyzer sizes come from the file’s standard curve, point to point over aligned migration time, as the instrument sizes (sized_by: instrument); TapeStation sizes are this reader’s: the lane is aligned to its ScreenTape’s ladder by the lower and upper markers (a linear map; with only the lower marker, run distances are scaled so it falls on the ladder’s) and size is interpolated point to point over run distance (its logarithm when the lane has only a lower marker) (sized_by: openreadout). - Table
samples: well, name, kind (ladderorsample), RIN or RINe and ratios, DIN, concentration, the software’s observations. Tablepeaks: one row per peak of every well, with the instrument’s size, position, height, area, concentration, molarity, % of total and observation (Lower Marker,Upper Marker). Tableregions(TapeStation): smear regions with average size, concentration, molarity and % of total. - Experiment: Agilent, the model, serial number, software and version, operator, run dates,
the assay as method name, parameters such as
run_temperature,run_time,size_unit,ladder_well,screentape, chip and reagent lots.
Validation
cargo test -p openreadout-corpus-tests --features corpus (tests/corpus/chip_oracle/mod.rs,
oracle/chip_oracle.py): an independent pass over the XML in Python records each well’s sample
count and signal values; every peak the instrument sized lies on this reader’s size axis within
0.05 bp (Bioanalyzer) or within 3 bp or 3 % (TapeStation, where run distances are stored to 0.1 %).
The corpus files are Agilent’s demo runs (on the hold tier until their redistribution is
settled).
Vocabulary (public API of openreadout-ce, Agilent exports)
| identifier | meaning |
|---|---|
BioanalyzerReader |
reader of Bioanalyzer XML exports |
BIOANALYZER_FORMAT_ID |
agilent-bioanalyzer-xml |
TapeStationReader |
reader of TapeStation exports |
TAPESTATION_FORMAT_ID |
agilent-tapestation |
Pictures
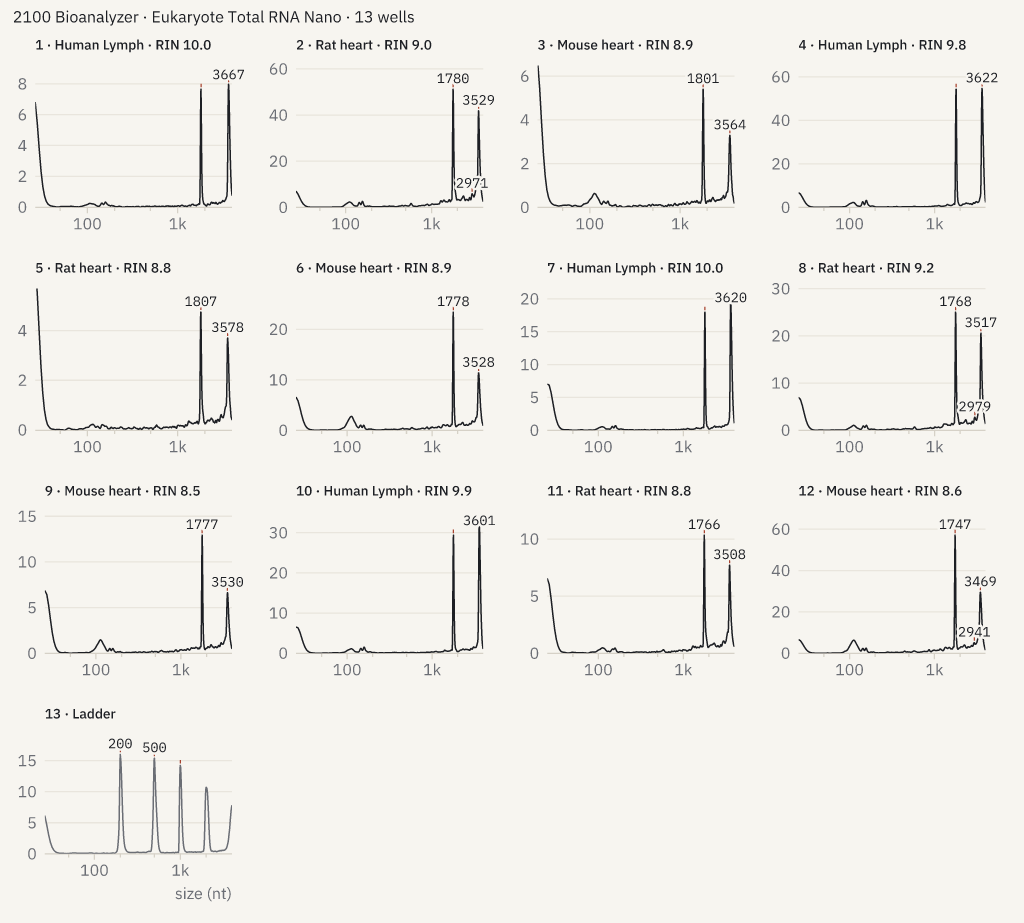
openreadout preview chip.xml draws every well as a small electropherogram on a log size axis,
titled with the well, the sample and its RIN or DIN, with the tallest peaks labelled by size;
--trace N draws one well large and --x-range 100:1000 zooms.
Examples
openreadout info chip.xml # assay, instrument, wellsopenreadout table chip.xml --table 0 # samples: name, RIN, concentrationopenreadout table chip.xml --table 1 # the instrument's peaksopenreadout analyze peaks chip.xml --trace 3 --channel 1 # peaks of one well, sized hereopenreadout info run.xml # TapeStation: reads run_Electropherogram.csv tooHow these readers were derived, file by file: provenance log.